

RIA Ideas - Consumer Surplus
Growth Note · Worst of XLY / XLP
Americans spent 6% more at stores and restaurants than a year ago, and the stocks that sell to them are down more than 5% this year.
Retail and restaurant sales rose 6.0% from a year ago (RSM via Daily Chartbook, 9/17/26), yet XLY, the consumer discretionary ETF, is down 5.3% this year while staples (XLP) are up 8.6% and the S&P 500 (SPY) is up 14.3% (Yahoo Finance, 9/22/26 close).
Discretionary plus staples are now the smallest slice of the S&P 500 on record (Bespoke via Vol Pulse, 9/16/26), yet store sales, jobs, wages and card balances all still look healthy in the four readings below. The stocks may simply be running a step behind the shopper.
The shopper keeps spending while consumer stocks trail the market
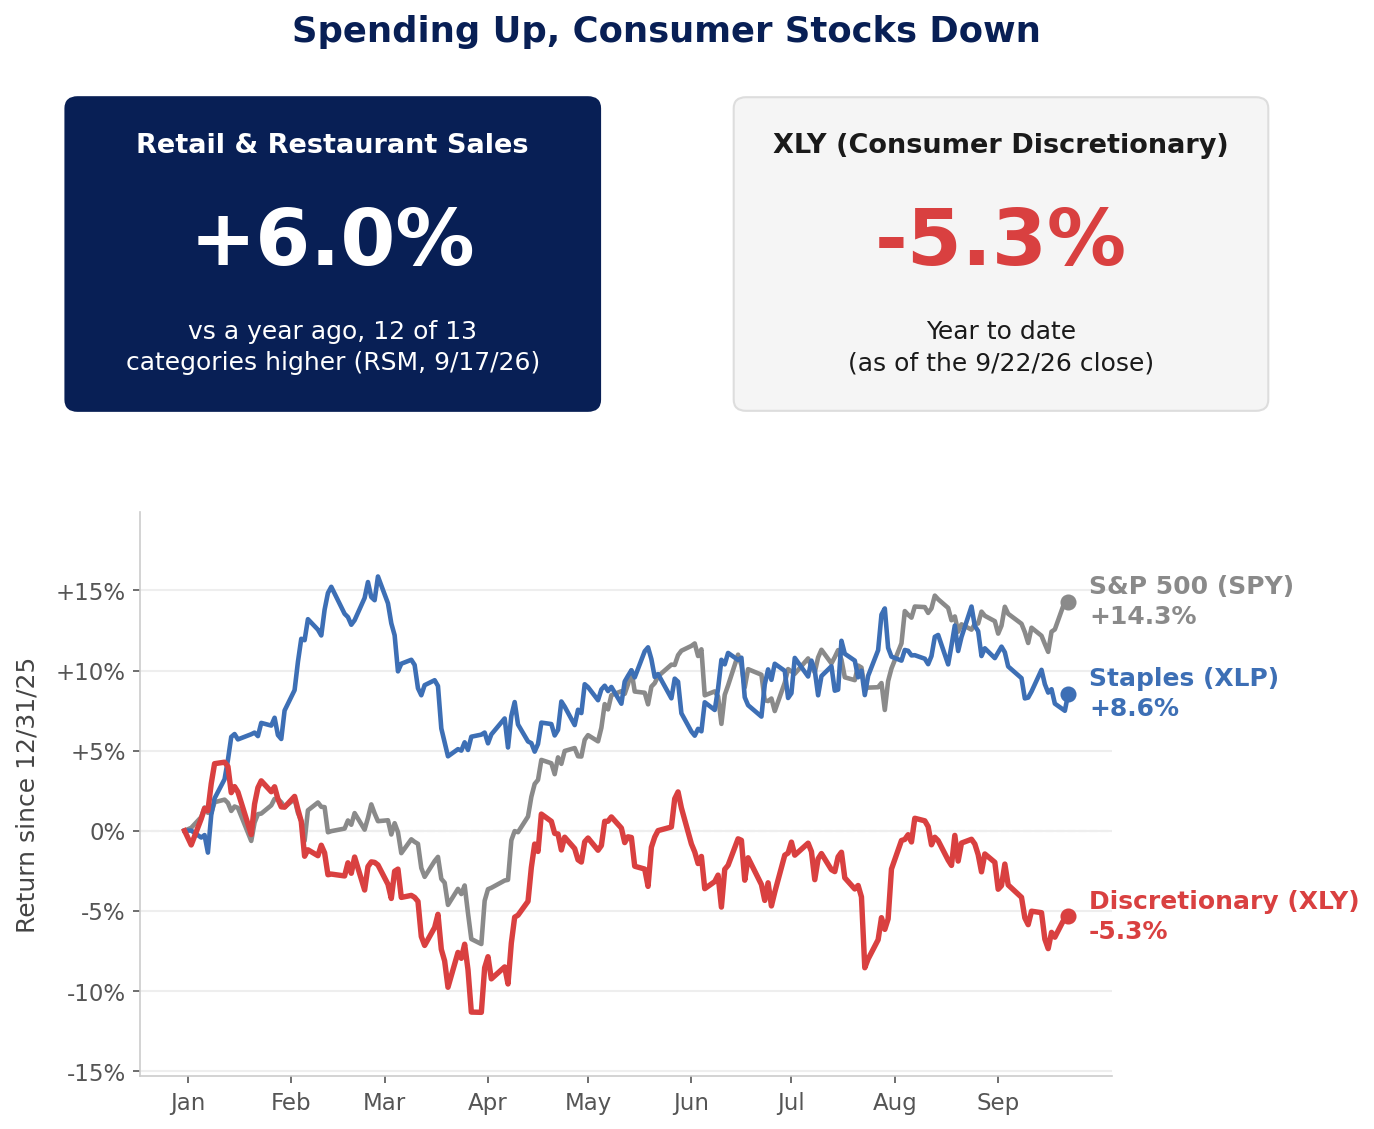
Retail and restaurant sales: RSM via Daily Chartbook, 9/17/26. XLY, XLP, SPY: Yahoo Finance, daily closes 12/31/25 through 9/22/26 · marinelayeradvisors.com/insights
Four more signs the consumer is still standing
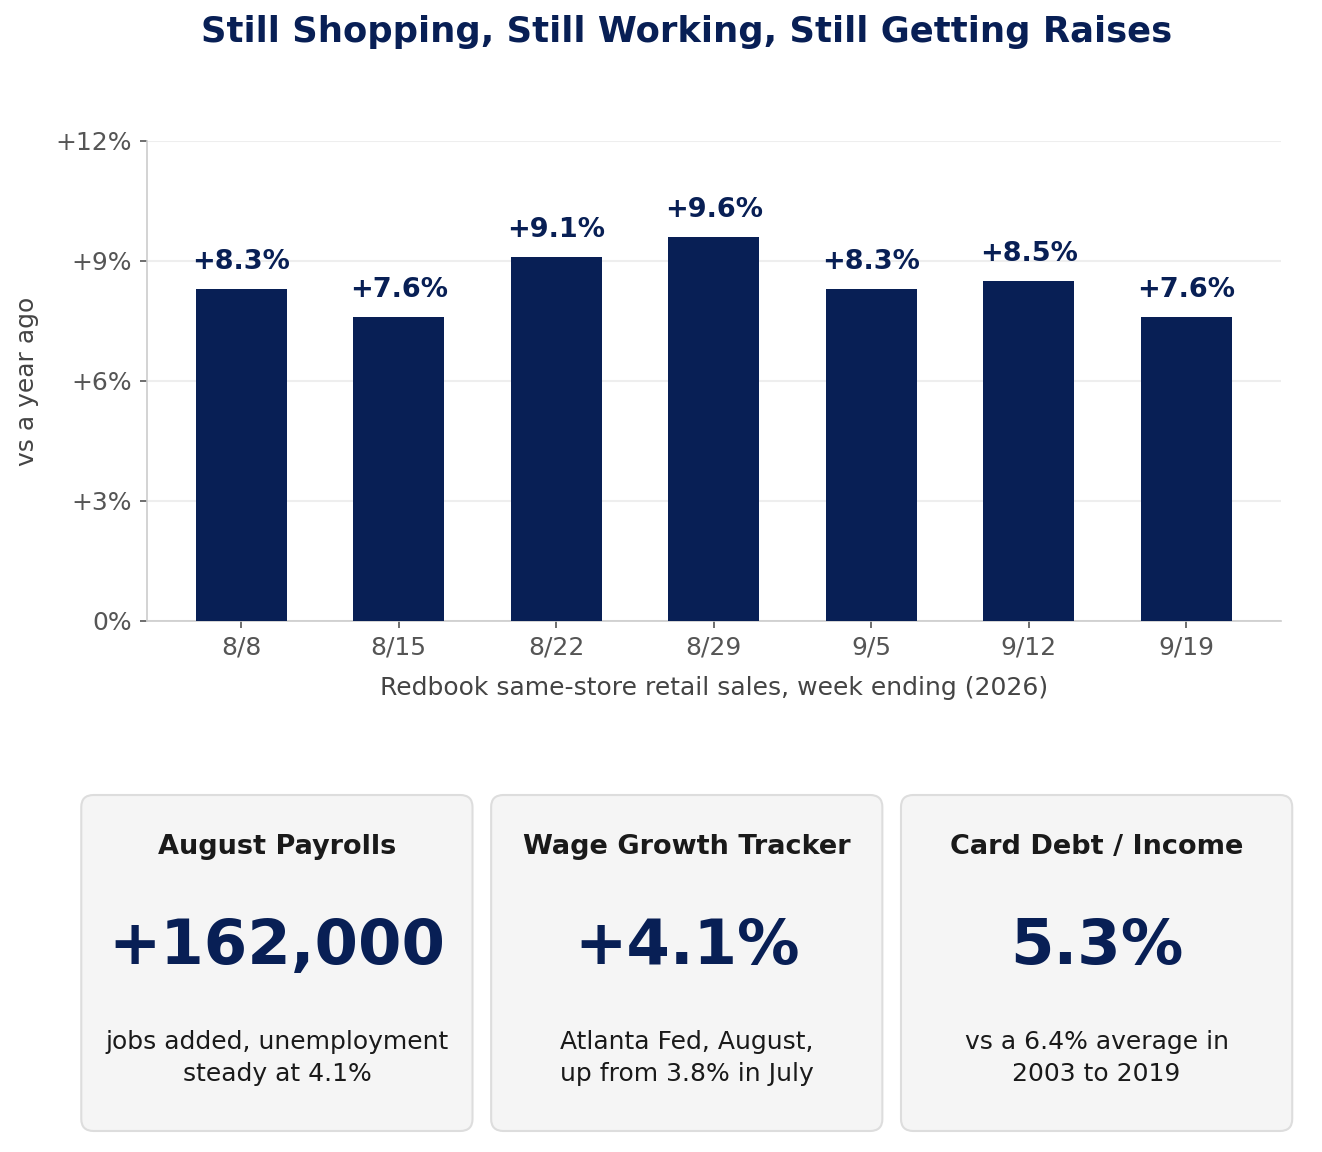
Redbook: Koyfin via Daily Chartbook, weeks ending 8/8 to 9/19/26. Payrolls and unemployment (August): Haver Analytics via Daily Chartbook, 9/5/26. Wage Growth Tracker (August): Atlanta Fed via Daily Chartbook, 9/12/26. Card debt to disposable income: Ryan Detrick via Daily Chartbook, 8/20/26.
Here is an example: Goldman Sachs indicatively priced this on 9/22/26 (terms may change with market conditions):
3-Year Worst-Of Growth Note
Goldman Sachs · Worst of XLY / XLP
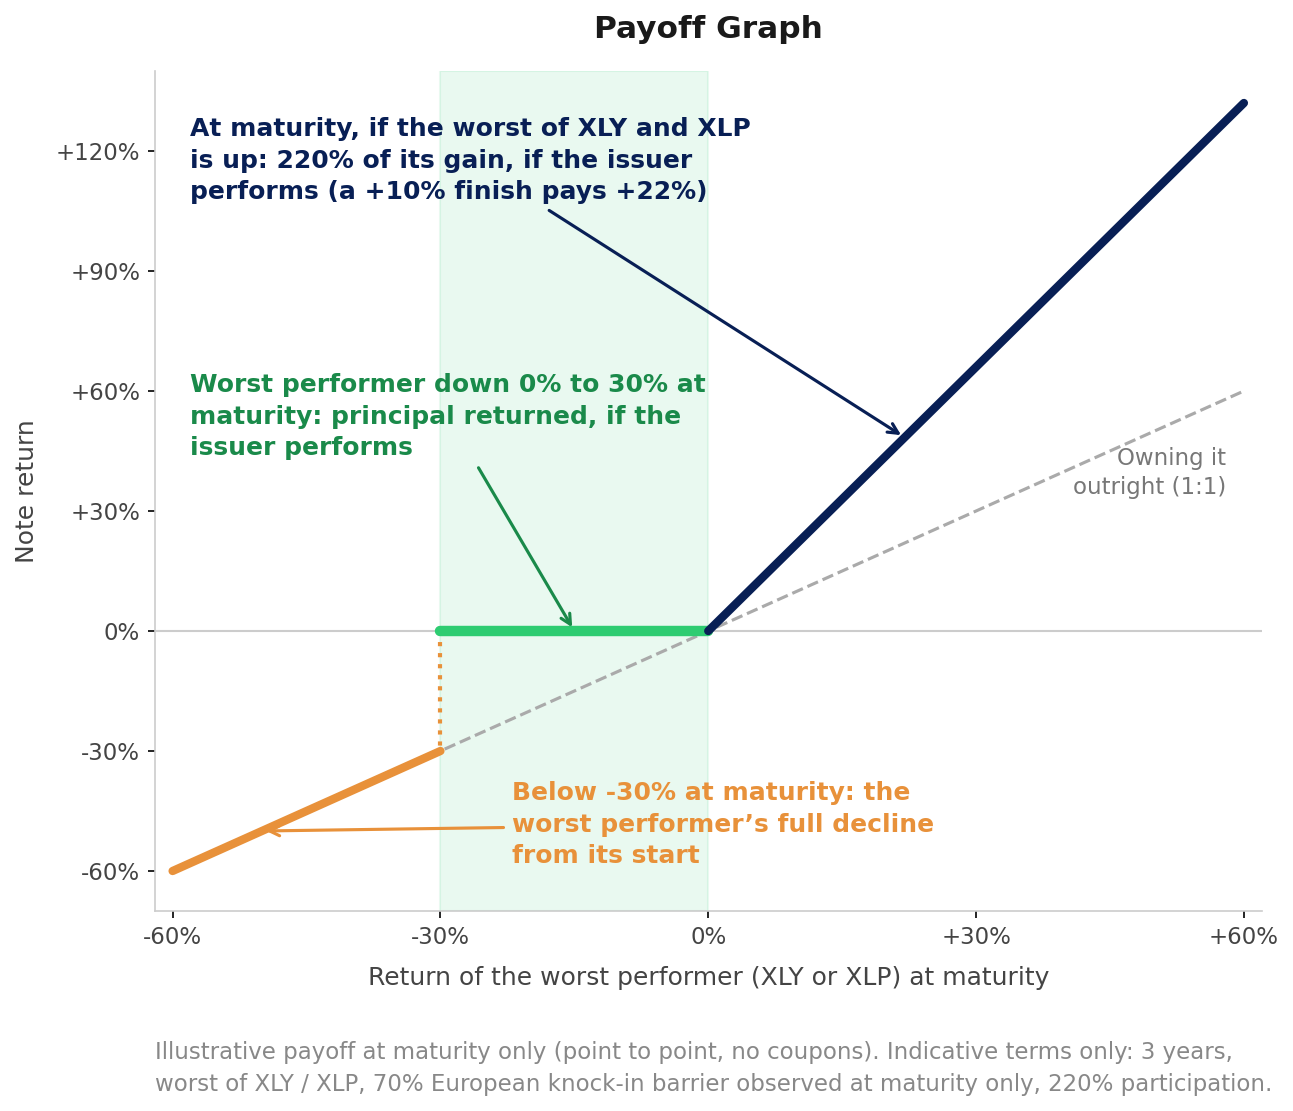
Upside at maturity | 220% participation on the worst performer’s gain from its start, uncapped, paid only at maturity |
Barrier | 70% of initial (European knock-in), observed at maturity only. Below it, principal is reduced by the worst performer’s full decline from its start |
Principal | All payments on the note are obligations of the issuer and are subject to its credit risk. |
Coupons | None. Point to point, no early call |
Tenor | 3 years |
The note pays on whichever of XLY and XLP does worse at maturity, so a strong finish by one may not offset a weak finish by the other. The two have moved largely independently (1-year daily return correlation of 0.17, Yahoo Finance, 9/22/26), which may raise the chance that one of them finishes below the barrier compared with either fund alone. Principal is at risk below the barrier: if the worst performer finishes under 70% of its start, the holder takes its full decline. Any gain is paid only at maturity; nothing is paid along the way.
These were indicative levels: Goldman Sachs indicatively priced this on 9/22/26. Pricing can vary depending on market conditions.
Here’s how the note pays at maturity:
Want to see more thematic trades for your customers?
Any investment decision must be based solely on the issuer's prospectus and pricing supplement, which are available on request.
This material is intended solely for the recipient and may not be forwarded, reproduced or distributed to retail investors.
This material is for informational purposes only and does not constitute a recommendation or an offer to buy or sell any security. Data sourced from public sources and has not been independently verified. All terms shown are indicative, were priced by Goldman Sachs on 9/22/26, and are subject to change, final pricing, issuer availability and market conditions at the time of execution; they do not represent an offer or a quotation. Return of principal depends on the issuer performing its obligations in full, and every outcome described in this material assumes it does. The notes are unsecured senior obligations of the issuer, are not guaranteed, insured or collateralized, and an issuer default or credit deterioration could result in the loss of some or all of an investment regardless of how XLY and XLP perform. If the worse performing of XLY and XLP finishes below its barrier at maturity, the investor is exposed to that fund’s full decline from its initial level. The notes pay no coupons, are not listed on any exchange and may have limited or no liquidity before maturity. Retail sales, Redbook, payroll, wage and card debt figures describe the U.S. economy and consumer and are not a description of the holdings of XLY or XLP. Past performance is not indicative of future results. Structured notes involve risks including potential loss of principal and may not be suitable for all investors.