

Volatility Pulse — Best of Times...Worst of Times
Off the Charts Shorts
Notional short selling across single stocks hit the highest level on record in Goldman data going back to 2016.
.png)
Source: @MacroCharts
Return to Reasonable?
Forward P/E for Software and IT is at the lowest its been in almost a decade.
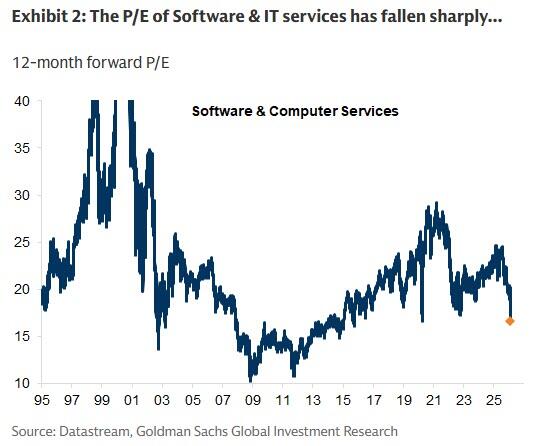
Source: ZeroHedge
Retail Buying Software Hand Over Fist
Rolling 1-month retail inflows to IGV software ETF surged to a record $176mn—most aggressive in years.
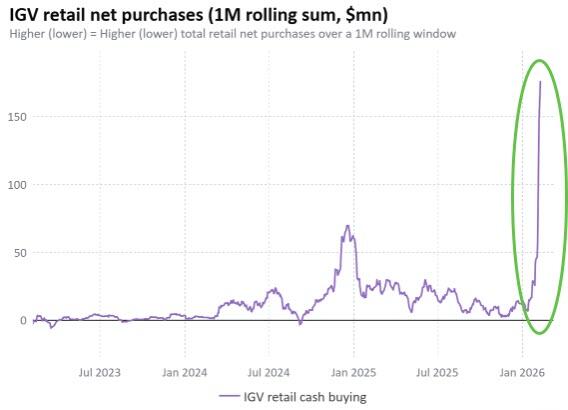
Source: ZeroHedge
Tides Have Turned
US is still 63% of global market cap, but the relative trade is flipping—dollar weakness providing mechanical tailwind to foreign returns.
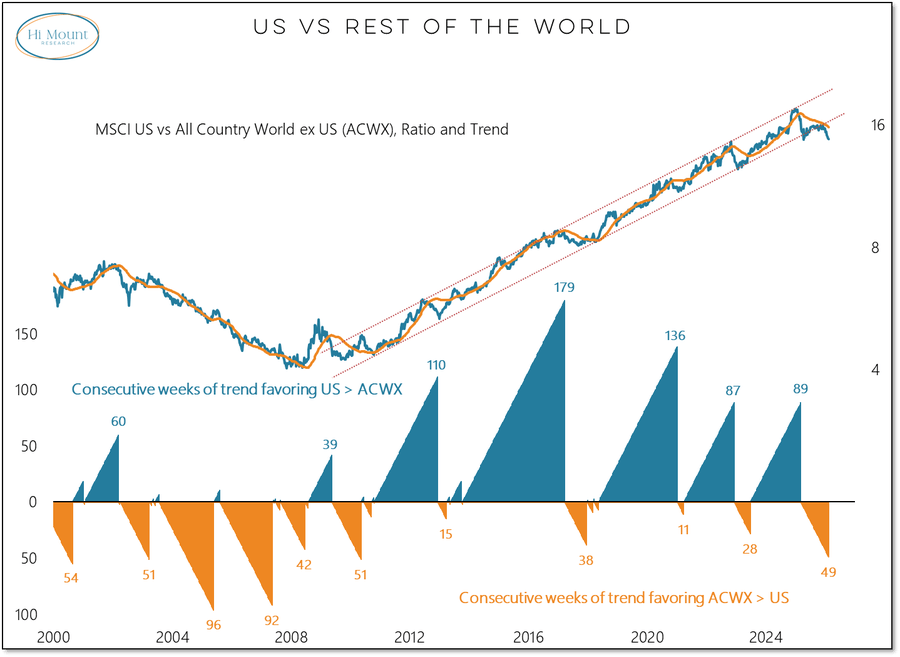
Source: @WillieDelwiche
Revenge of the World
Non-US equities posting one of their best starts to a year in four decades—MSCI World ex-USA up 11 weeks in a row.
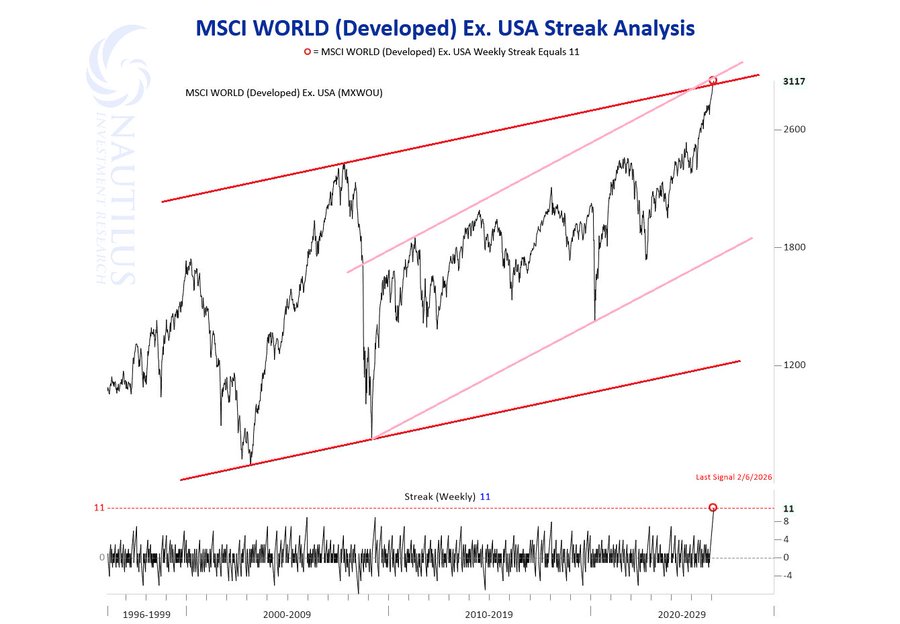
Source: @NautilusCap
Even Small Caps Are Finally Joining
We're barely started the year but the RTY outperformance over NDX is quite something.
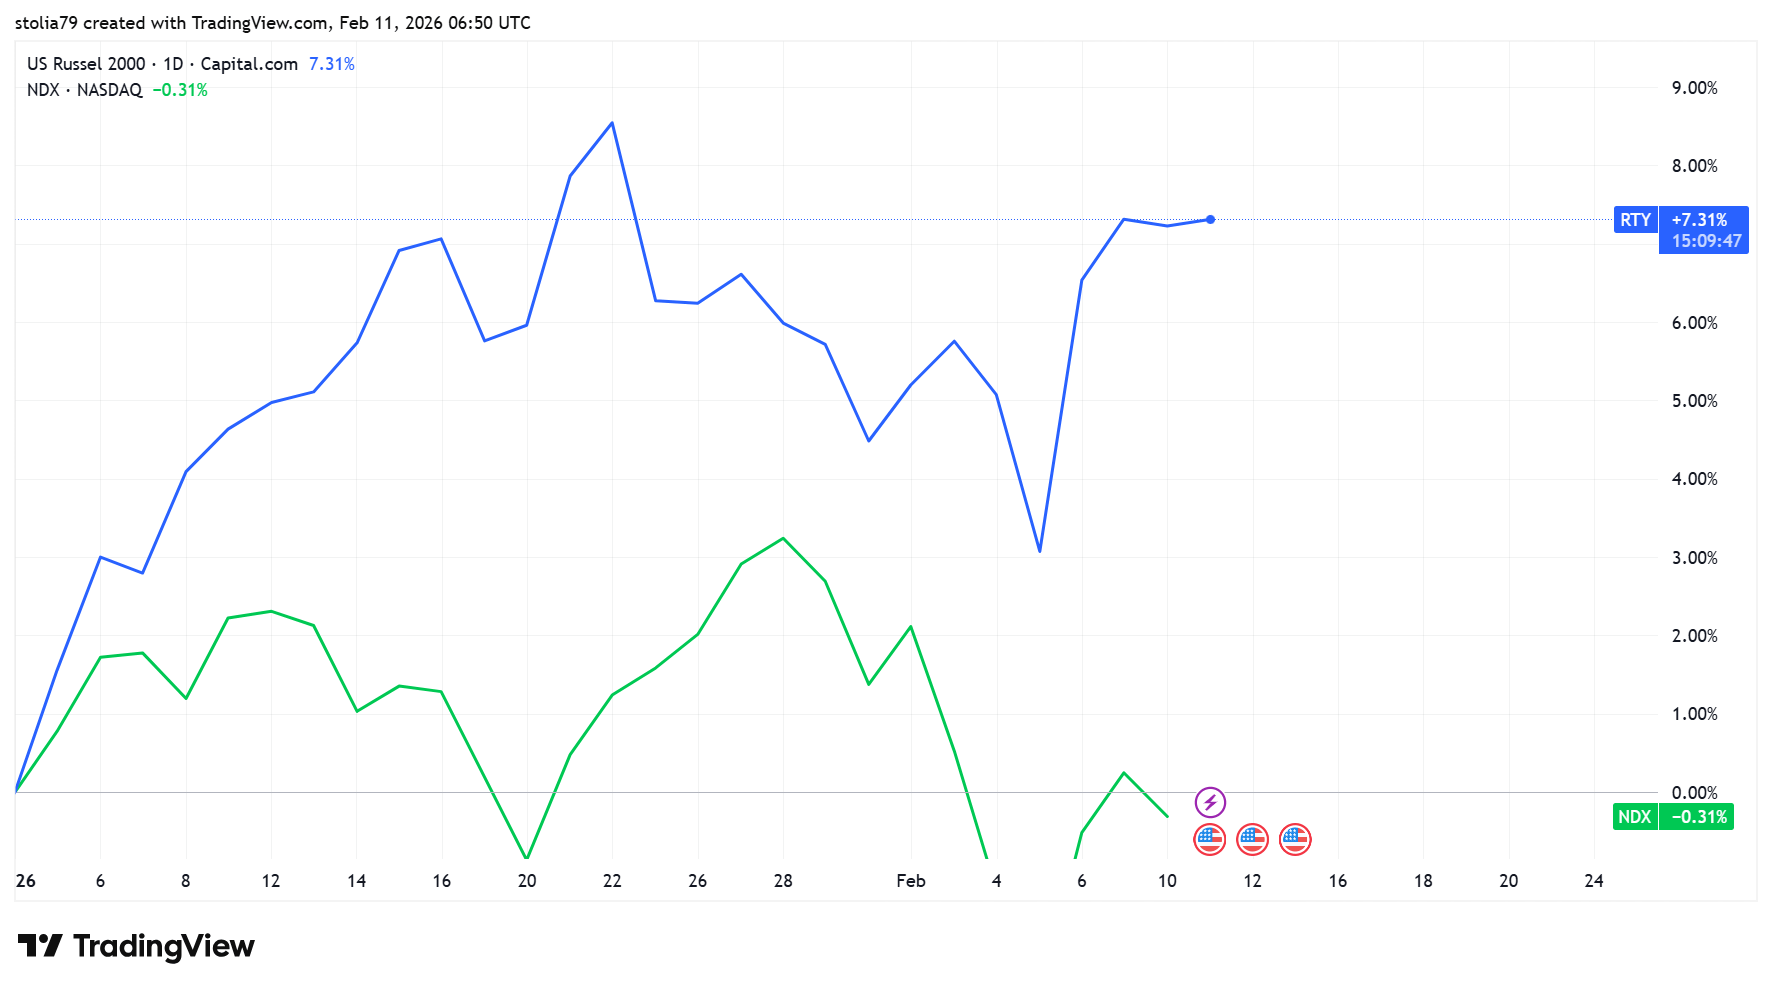
Source: TradingView
Pain for Low Income Bucket
Consumer delinquency rates hit 4.8% in Q4—highest since 2017—driven by low-income and young borrowers cracking.
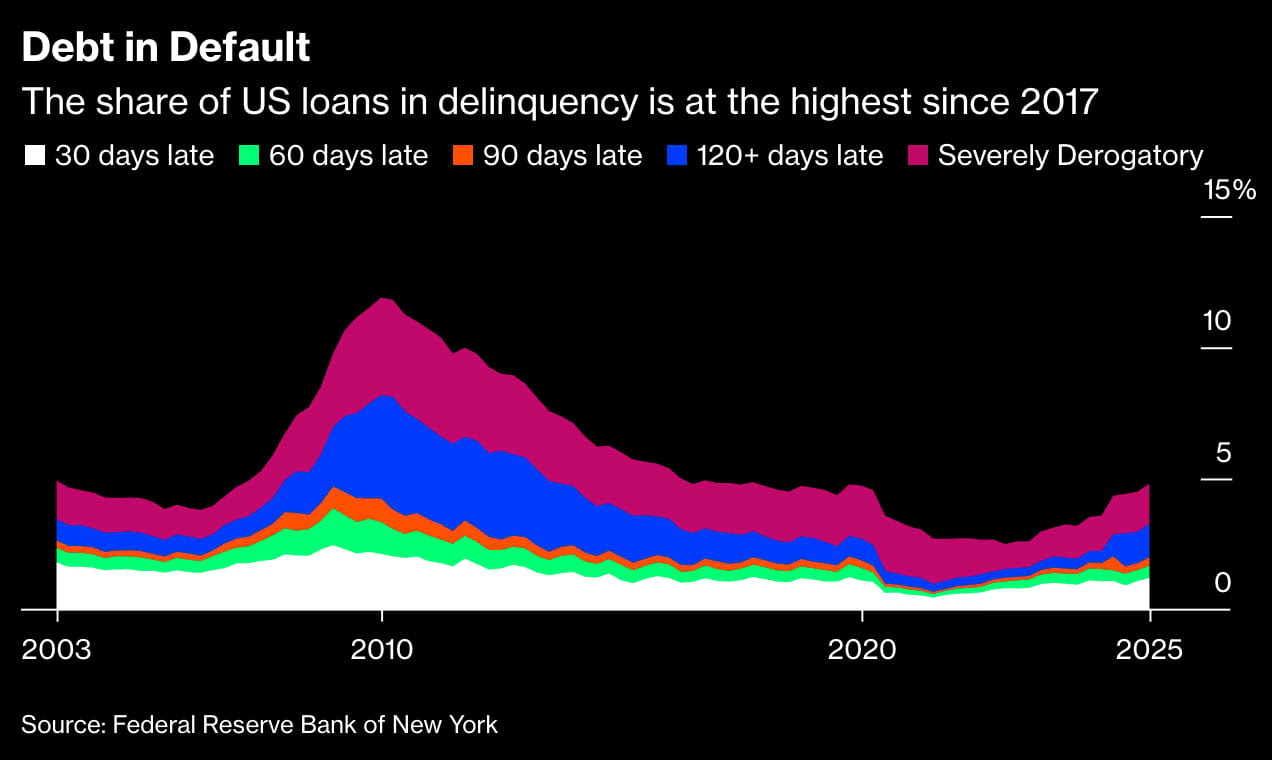
Source: Bloomberg
Boats and Planes for the Upper End
Air travel and cruise line stocks have ripped the past couple months. Higher end consumers are still spending big.
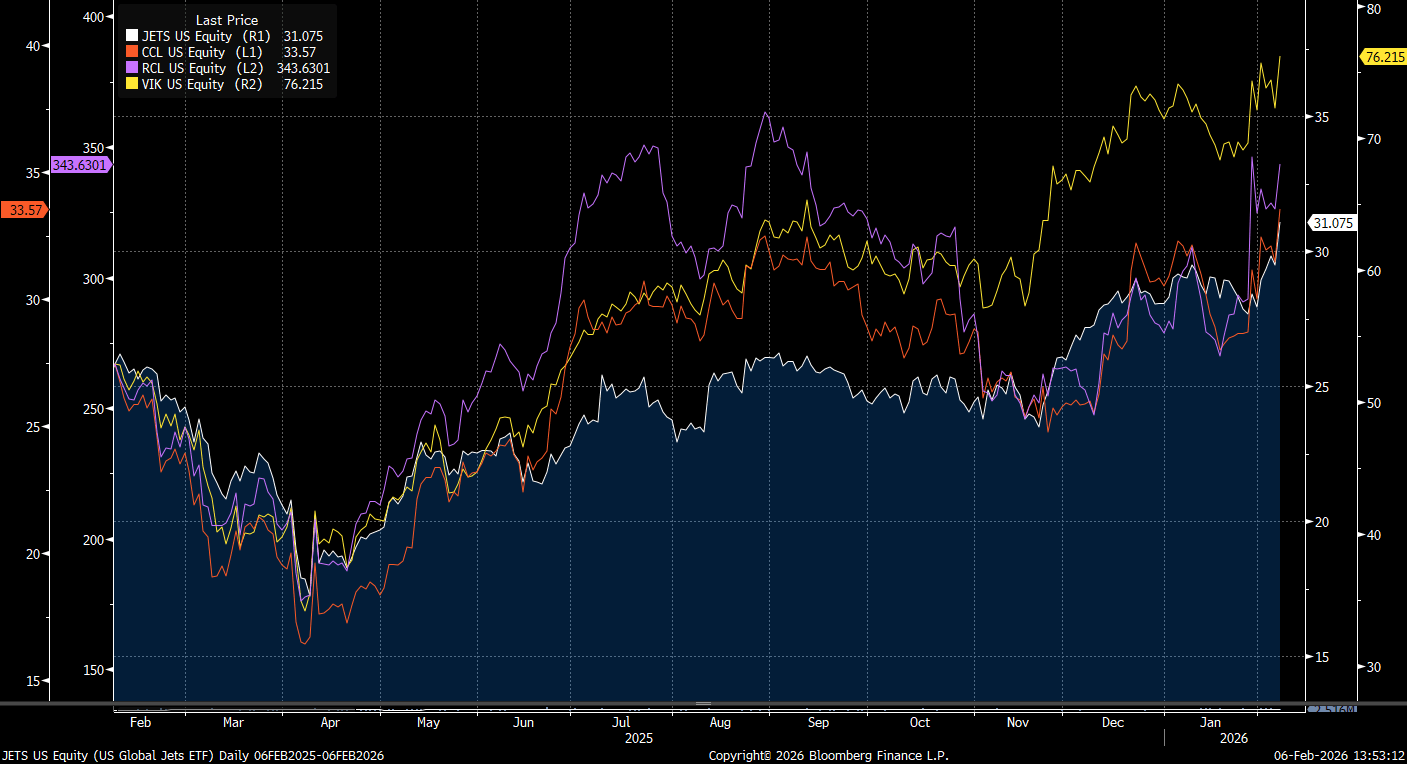
Source: Bloomberg
Small Biz Aren't Building Data Centers
Capex for small business is among the lowest in 15 years. Someone get these companies Blackwell chips stat.
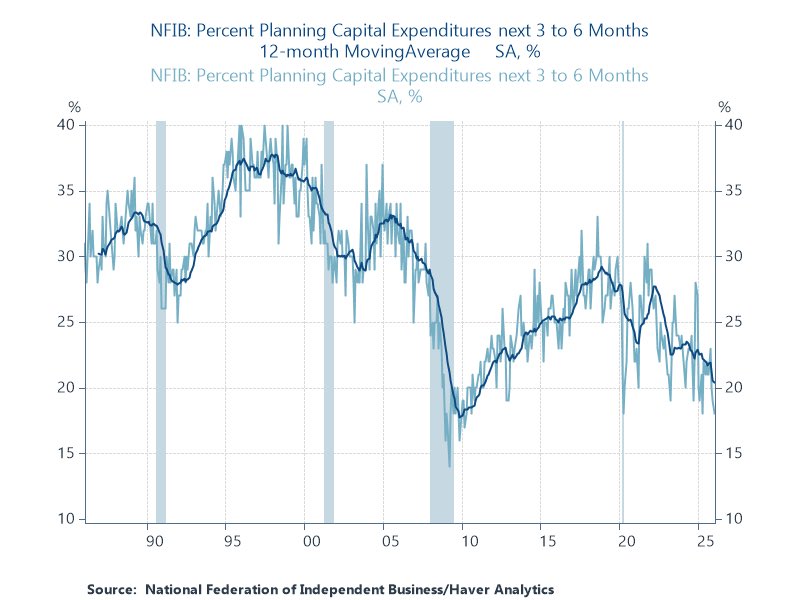
Source: @RenMacLLC
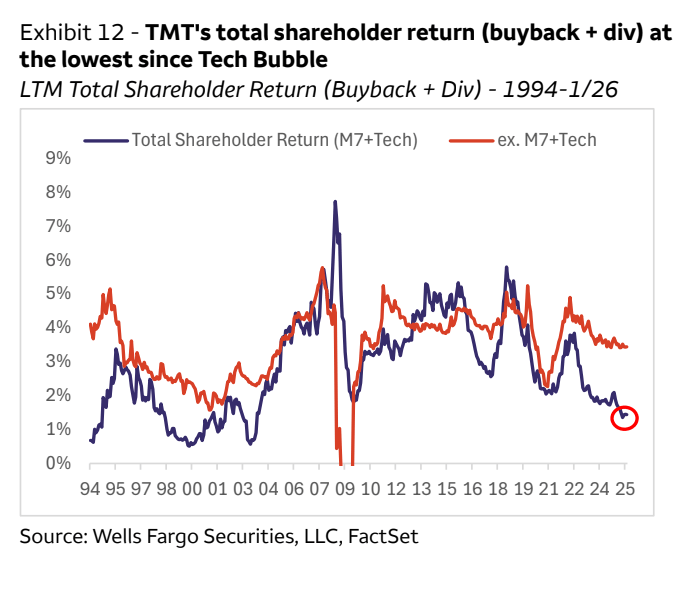
Buybacks or AI Build Out?
Mag 7 buybacks and dividends at lowest since tech bubble as capex devours free cash flow. What used to be dollars for share buybacks has been shipped right to NVDA.
Source: @_JoshSchafer
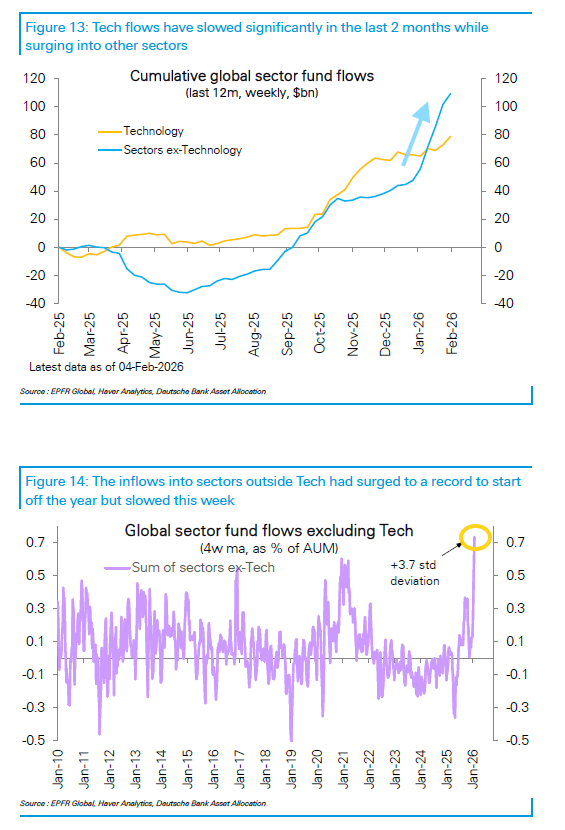
Paused on Tech Buying
Sector funds ex-Tech saw record $62bn inflows in first 5 weeks—more than all of 2025 combined—while Tech flows stall.
Source: @neilksethi
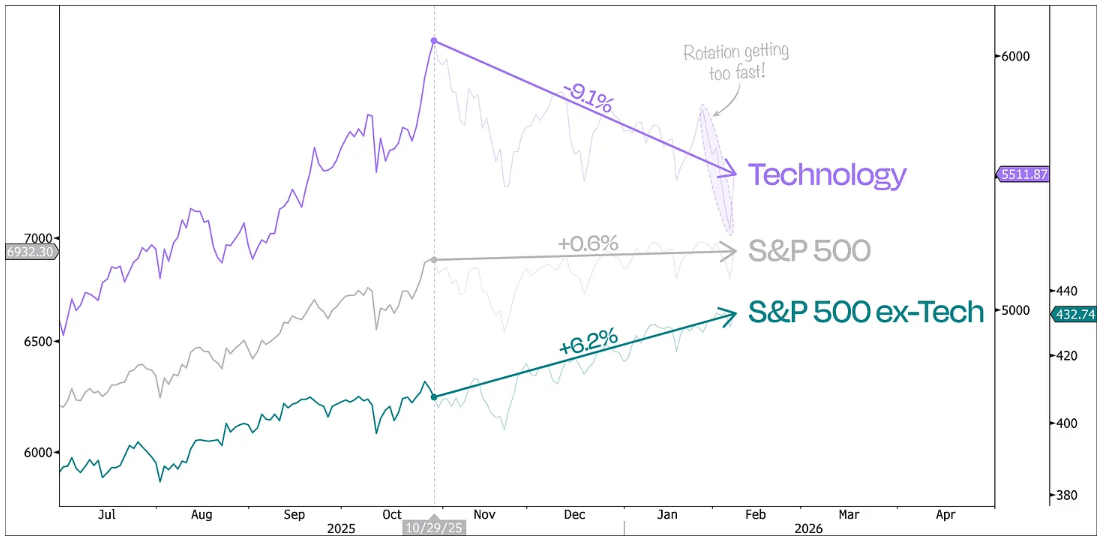
Making Up for Tech's Losses
The rout in tech has been made up for by the rest of the S&P picking up the slack.
Source: Duality Research
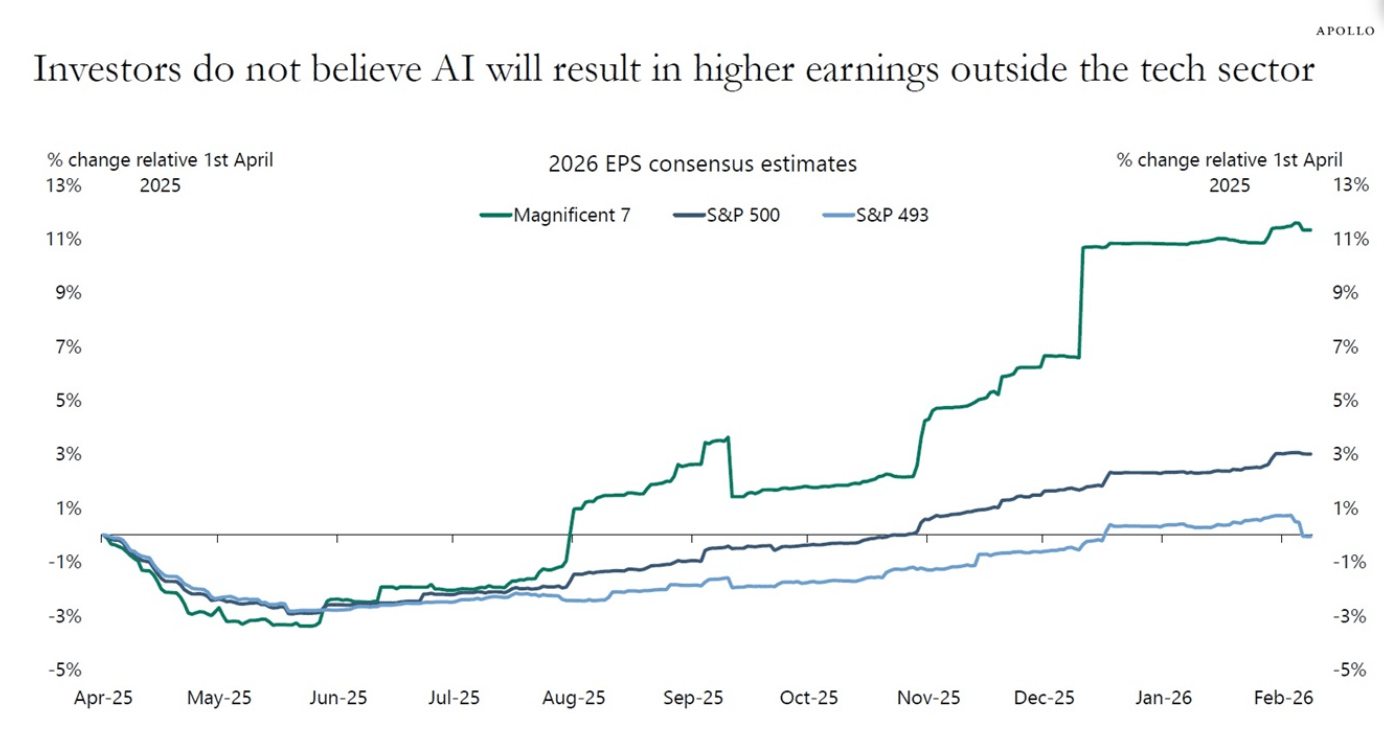
AI Gains but for Tech Only?
Consensus estimates see AI profits in tech but nowhere else....
Source: Apollo Academy
Just Because...
The immortal jellyfish—Turritopsis dohrnii can revert to its juvenile polyp state after reaching maturity, effectively making it biologically immortal. Scientists have watched individual specimens cycle through this process multiple times. Maybe it should run for political office in the US.
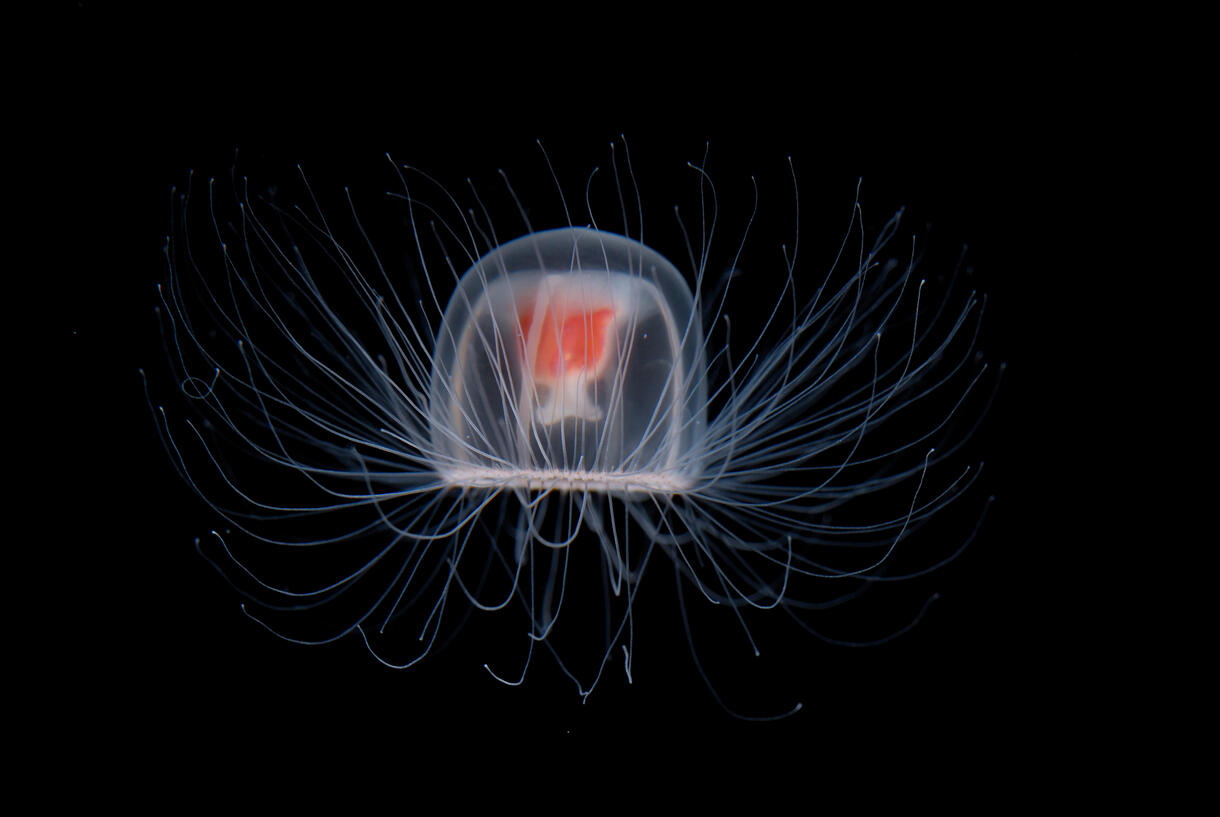
Source: American Museum of Natural History
Want more info? Let us now how to help
PROFESSIONAL USE ONLY: Any information or material provided above, is for information purposes only, and is intended only to facilitate general discussions and is not intended to be used as a general guide to investing, or as a source of any specific recommendation, and makes no implied or expressed recommendations concerning the manner in which clients’ account(s) should or would be handled, as appropriate strategies depend on the client’s specific objectives. This does not constitute an offer or solicitation with respect to the purchase or sale of any security in any jurisdiction in which such an offer or solicitation is not authorized or to any person to whom it would be unlawful to make such an offer or solicitation. We cannot verify the accuracy and recipients should do their own research before making any decision.
NOT FOR RETAIL DISTRIBUTION: This communication has been prepared exclusively for institutional, wholesale, professional clients, and qualified investors only, as defined by local laws and regulations.