

Volatility Pulse - Still Waters Run Deep
Chaos Underneath a Flat Index
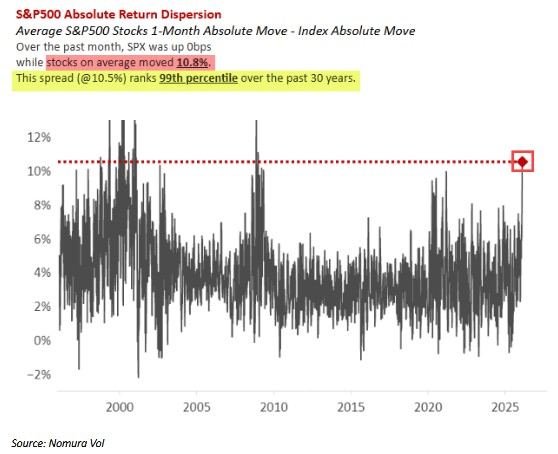
S&P 500 flat since Jan 15 but the average stock has moved 10.8% in absolute terms—Nomura says this level of dispersion has only shown up around serious macro shocks in 2000 and 2008.
Source: @JPokoTrades
Highs AND Lows: Never Seen Before
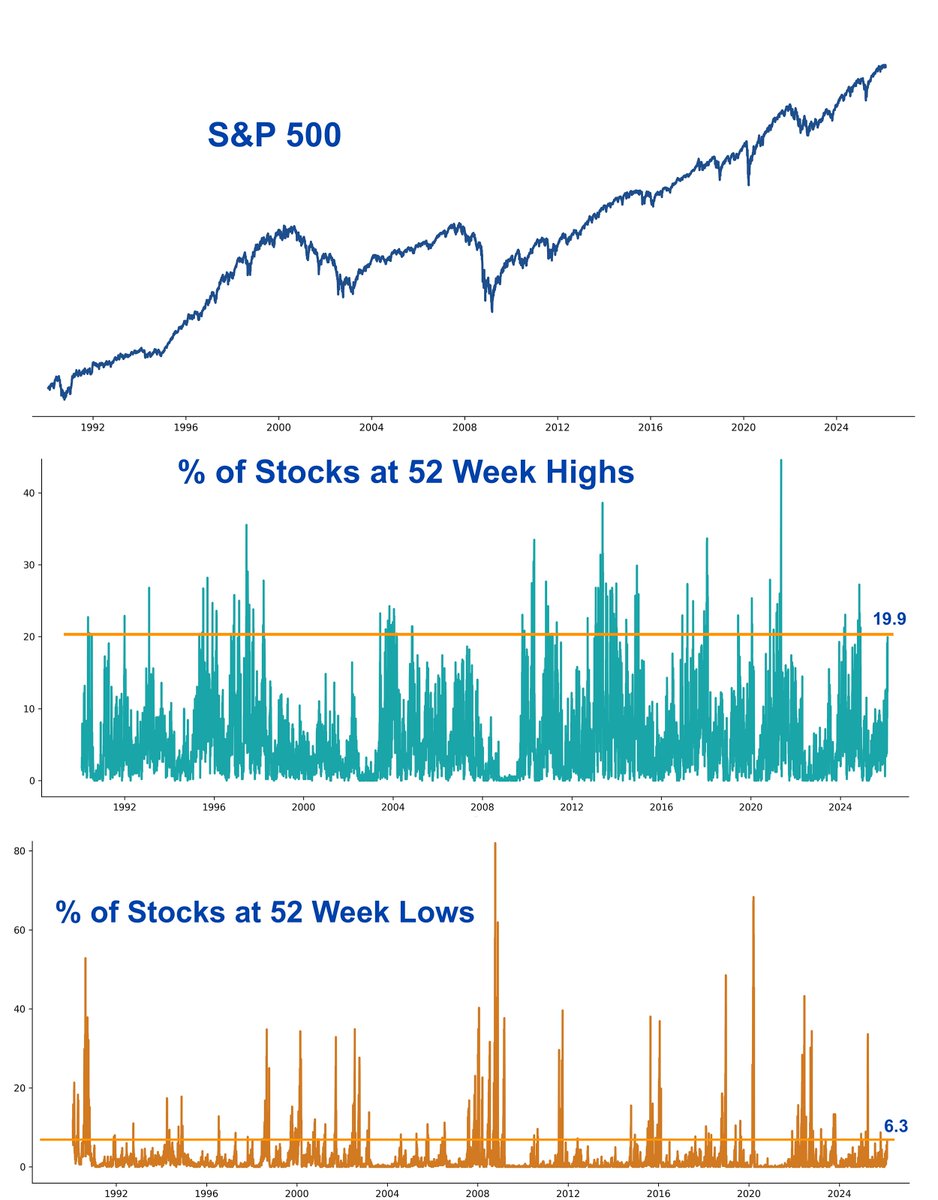
20% of S&P 500 stocks at 52-week highs while 6%+ at 52-week lows simultaneously—this split has literally never happened before.
Source: @TheMarketStats
The New AI Trade
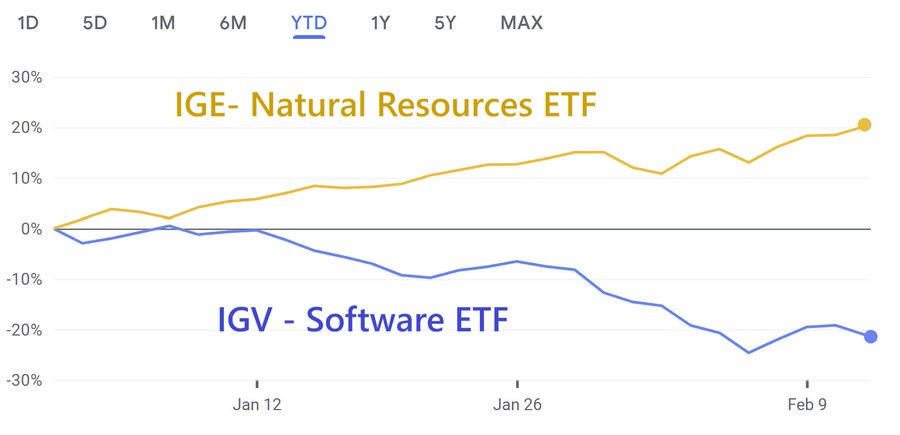
Why buy NVDA when you can purchase energy and materials layer below that?
Source: @johnarnold
Most Shorted, Most Loved
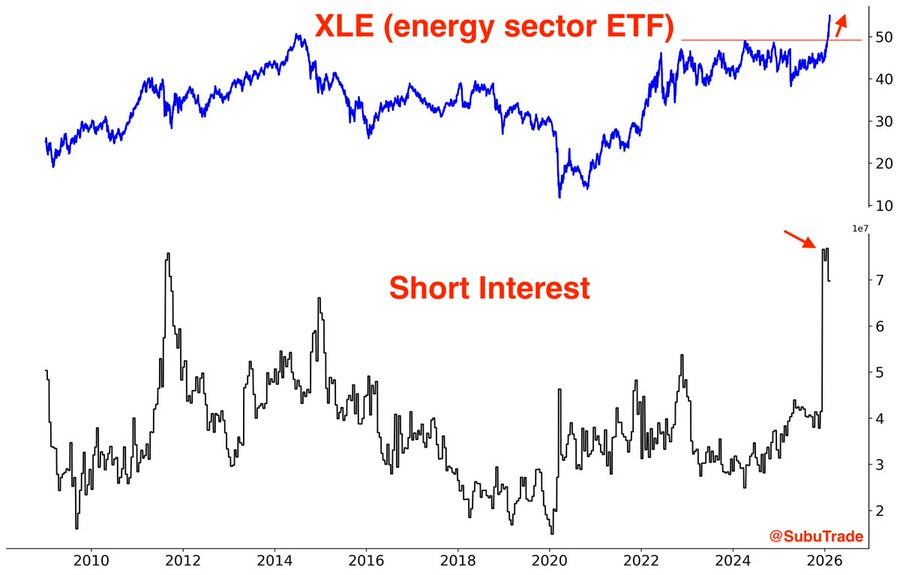
Energy sector short interest near highest in over a decade—yet XLE just broke out to 7 straight weeks of outperformance vs SPX with a 25% performance differential.
Source: @SubuTrade
Shorts Pile On Tech — Squeeze Set Up?
Tech sector short interest at highest level of this decade—short-tech and software is now the most crowded trade on the street.
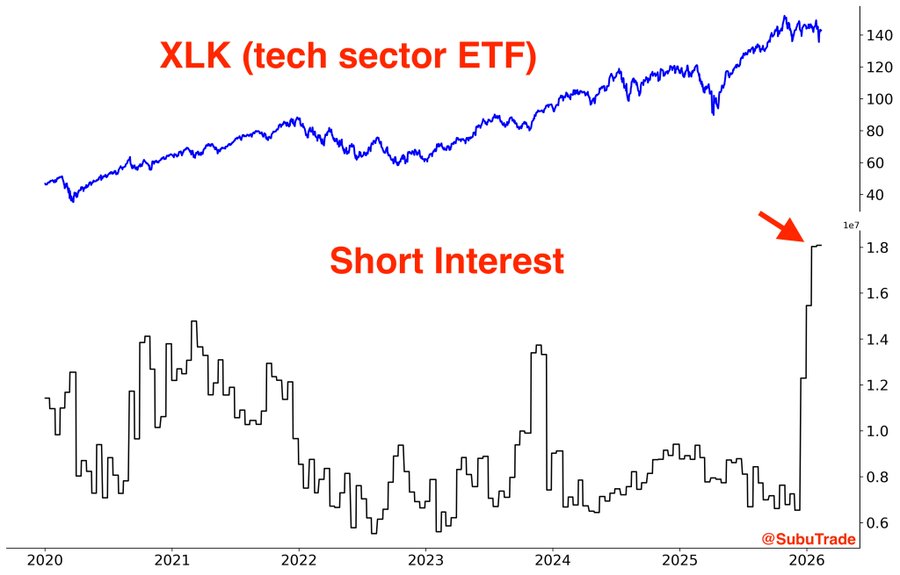
Source: @SubuTrade
Capex Is for the Birds
Capex for AI has been THE story of the last 2 years. Apple however has completely opted out of this buildout cycle.
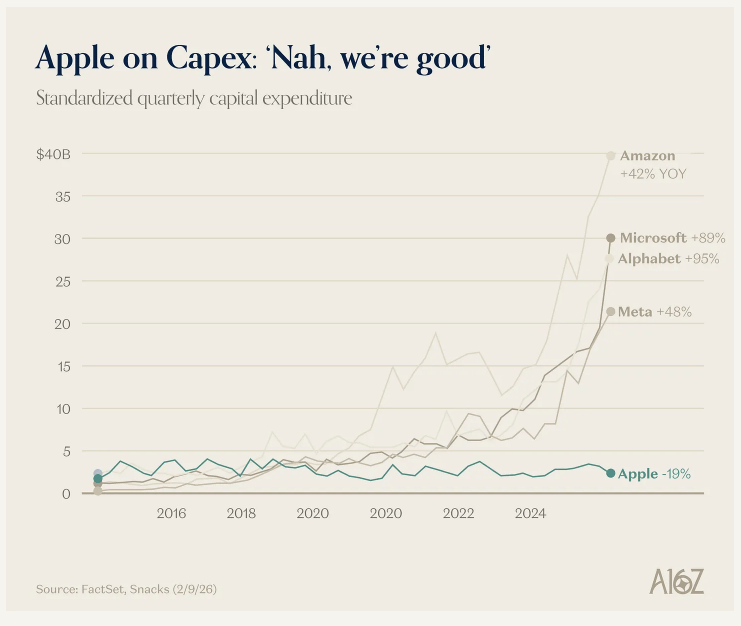
Source: @rohanpaul_ai
But What If They Miss the Boat?
Over the course of time high investment companies (heavily capital intensive) have not worked out well. We're not saying that tech companies will suddenly be in that bucket—but the track record is worth noting.
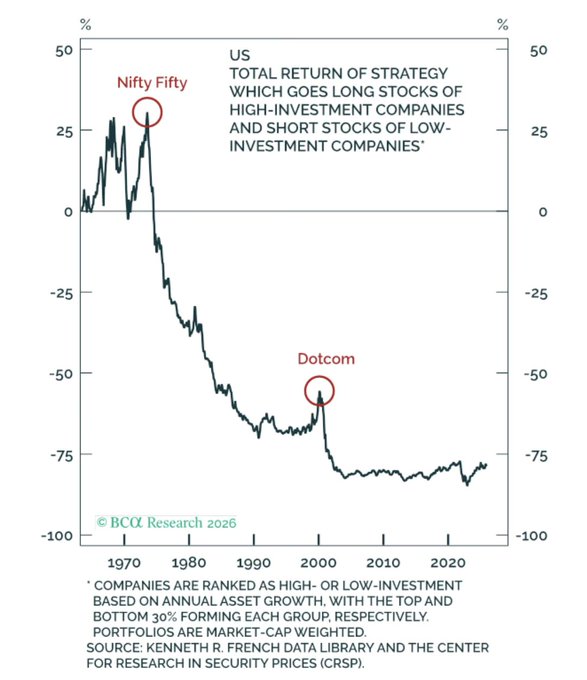
Source: X/Twitter
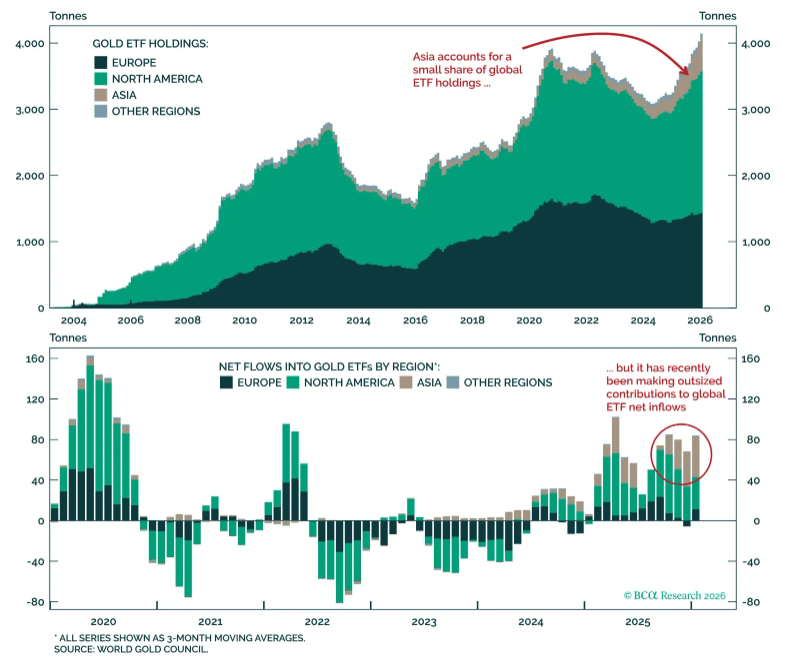
Follow the Money
Record smashing inflows for Emerging market funds.
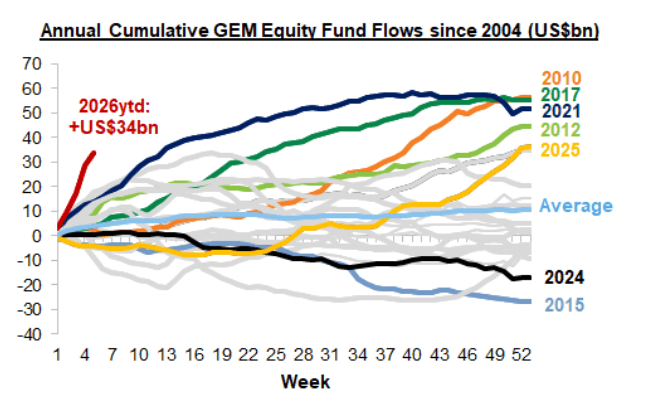
Source: @Mayhem4Markets
No Wonder the Money Is Flowing
SPY is up almost 20% since 2025. The rest of the world has been crushing the US since in that time period.
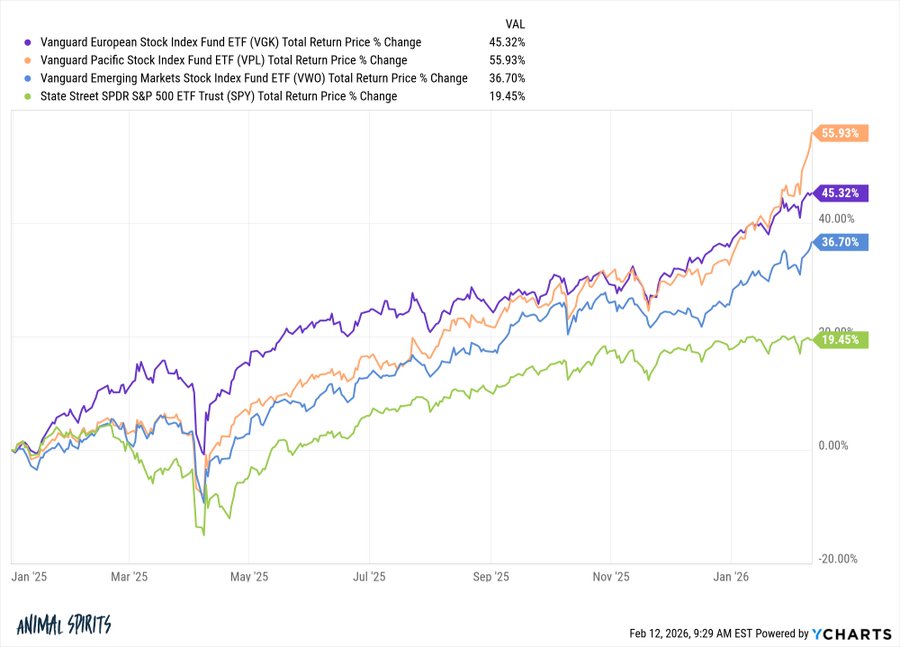
Source: @awealthofcs
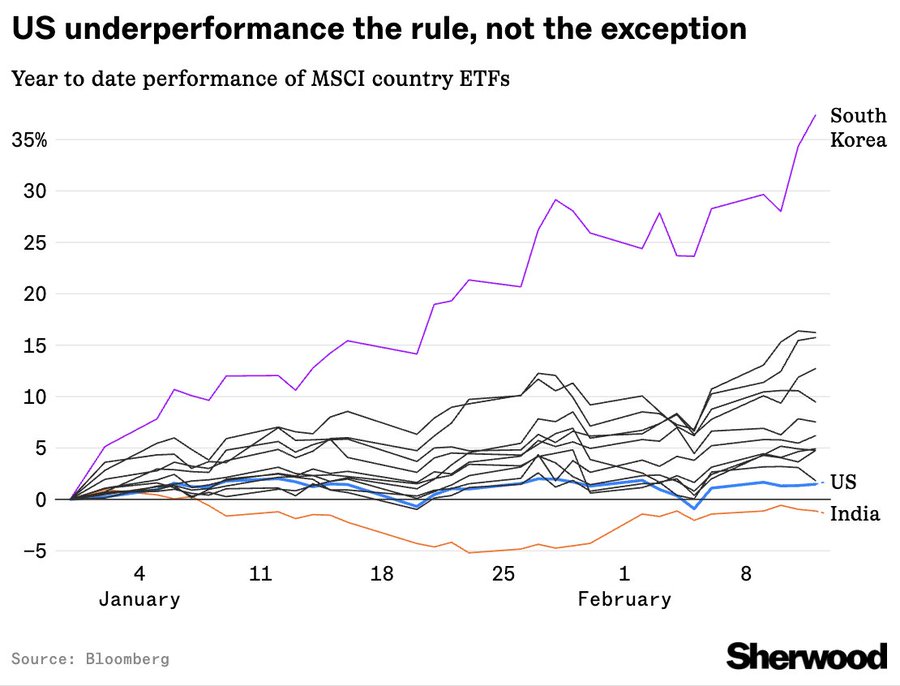
Just How Pervasive Is the Outperformance?
You have to go to the 10th-largest ex-US country in the ACWI ETF to find a place that's lagging the US in 2026.
Source: @LJKawa
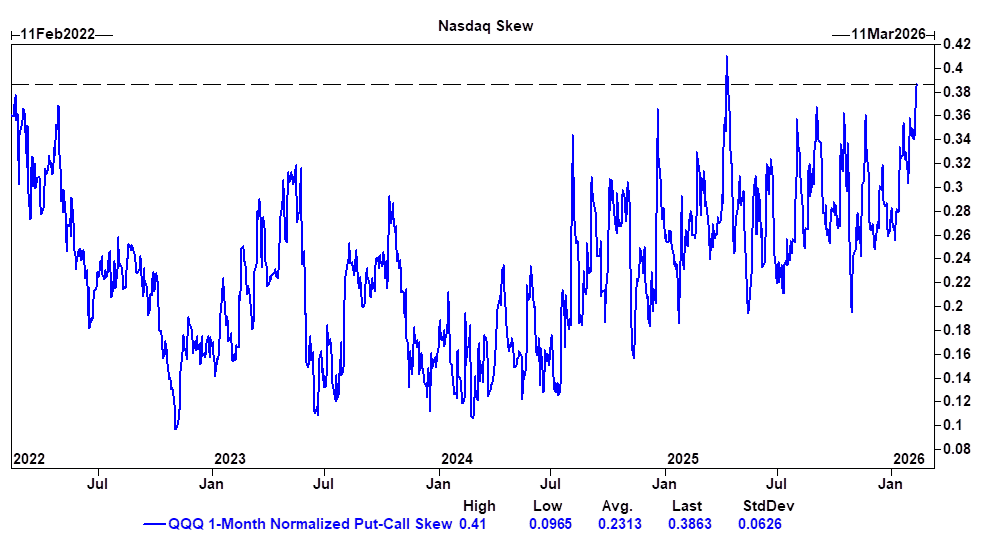
NASDAQ Protection Buying
Skew is the measurement between volatility of calls and puts. The higher this ratio the higher the demand for downside protection. We're currently near 4 year highs with the market only a couple of percent off its record highs.
Source: Goldman Sachs Research
The Only Thing the Market Agrees On
Gold hit all-time high of $5,595 in January—yet China's PBOC extended buying to 14 consecutive months and JPMorgan targets $6,300 by year-end.
Source: @RoukayaIbrahim
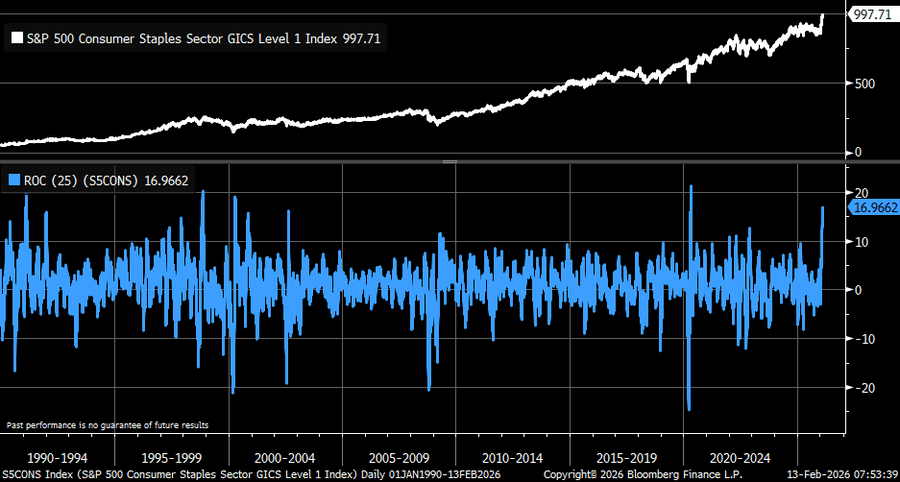
Toilet Paper Hoarding
On a rolling 5-week basis, the Consumer Staples sector is up by 17%. Going back to 1990, we have only seen stronger 5-week runs in: April 2020, April 2000, November 1998, February 1991.
Source: Apollo Academy
Just Because...
The Great Pyramid was built around 2560 BC. Cleopatra lived around 30 BC. The moon landing was 1969 AD. Cleopatra is closer to us ordering pizza on our phones than to the construction of the pyramids she's associated with.

Source: Quora